
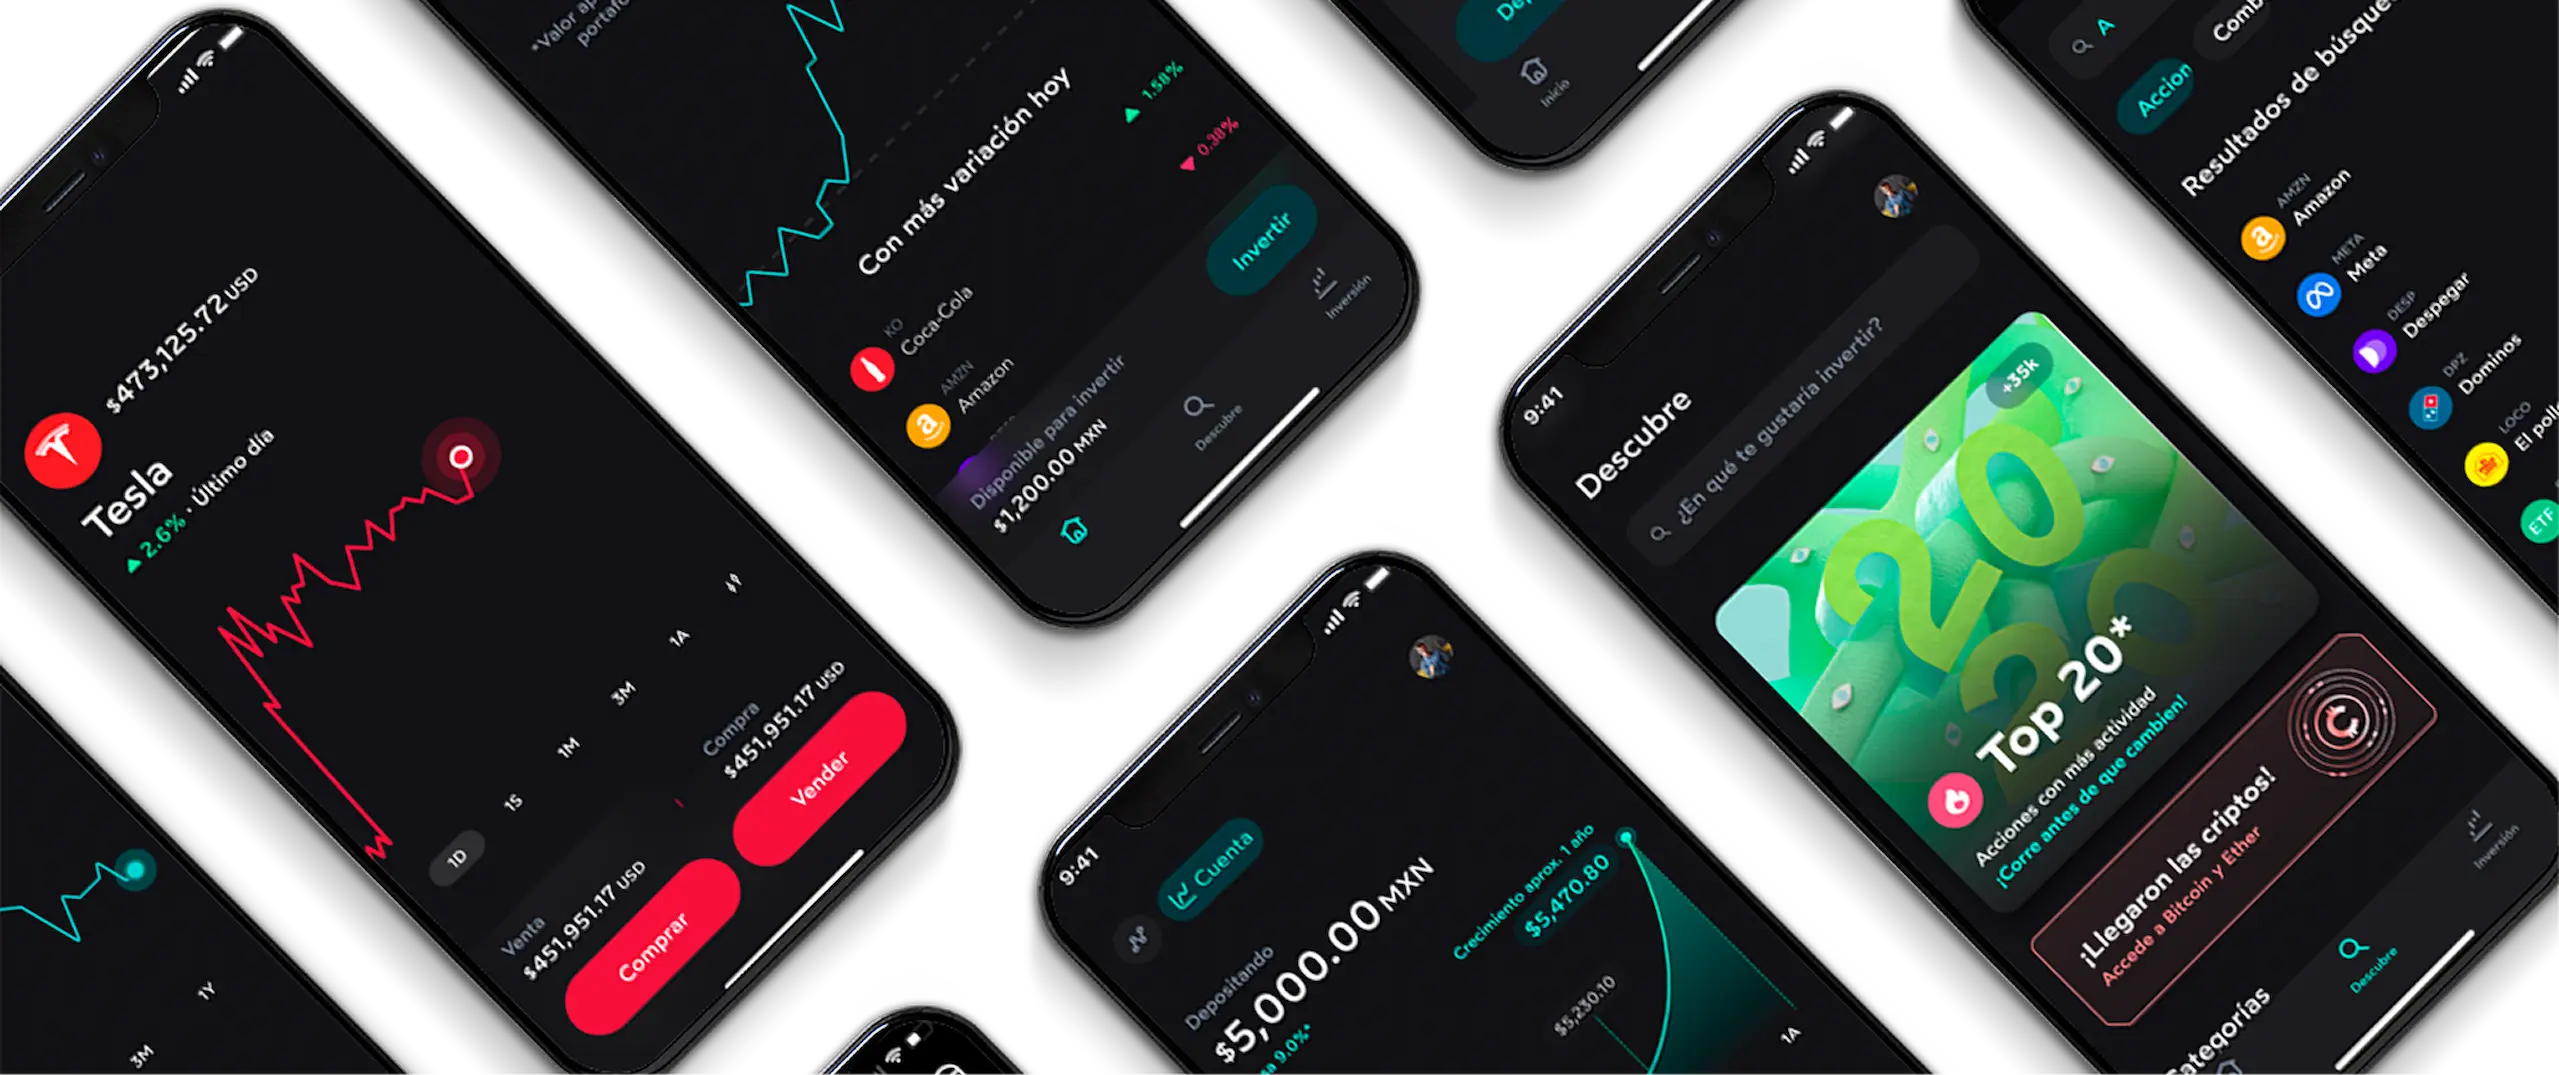

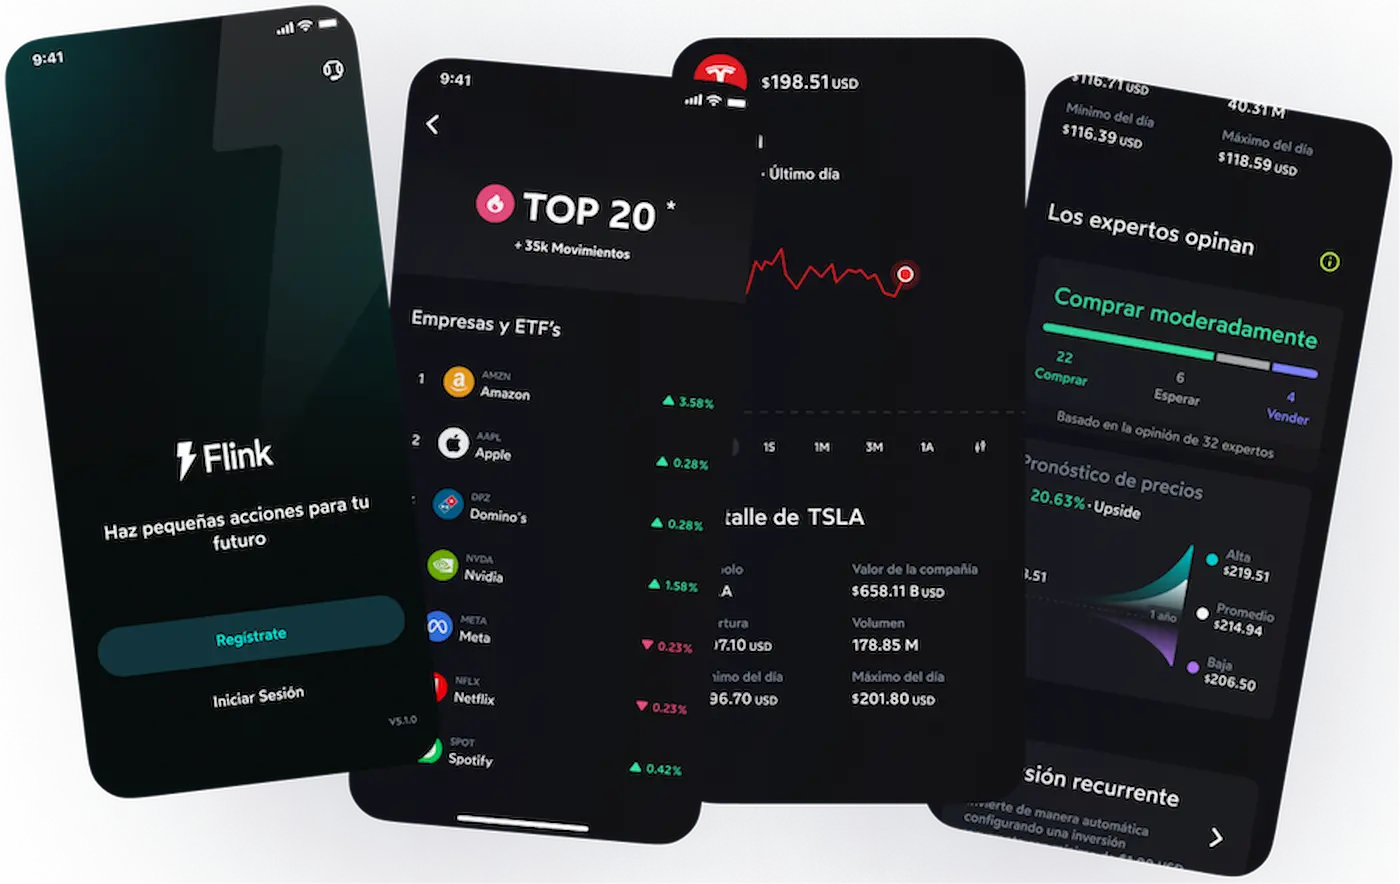
Flink is a Fintech Startup that seeks to democratize stock investments. The app allows users to invest in shares listed on the New York Stock Exchange (NYSE) and the Nasdaq with as little as 30 MXN. Users can later sell their shares for a profit or earn dividends. Additionally, Flink offers low-risk investment products and a savings account with daily returns.
When I joined the company, the app was in the official store but was experiencing three challeges: The volume of daily transactions wasn´t increasing enough, the users didn’t have the best experience on the app, so they found it difficult to make investment decisions, and a high percentage of users left before completing the onboarding process.
This case study focuses on addressing the first two challenges. The third challenge is excluded due to privacy considerations.
Personas
We had 4 user personas defined, but to address the two challenges, we focused on two. Our user persona represents the 2 types of users that don't have extensive knowledge in investments but are risk takers.
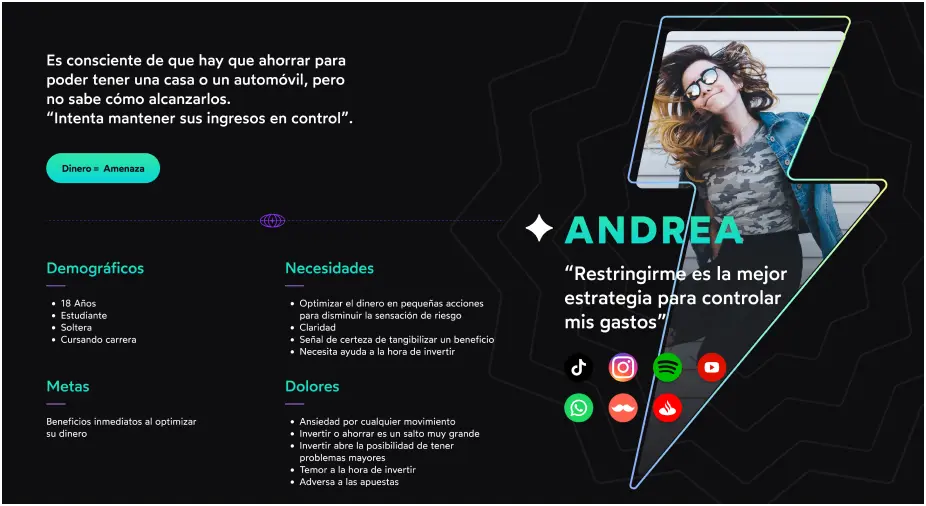
Andrea is our younger user; she is looking for new ways to increase his legacy but she is not sure how to do it.
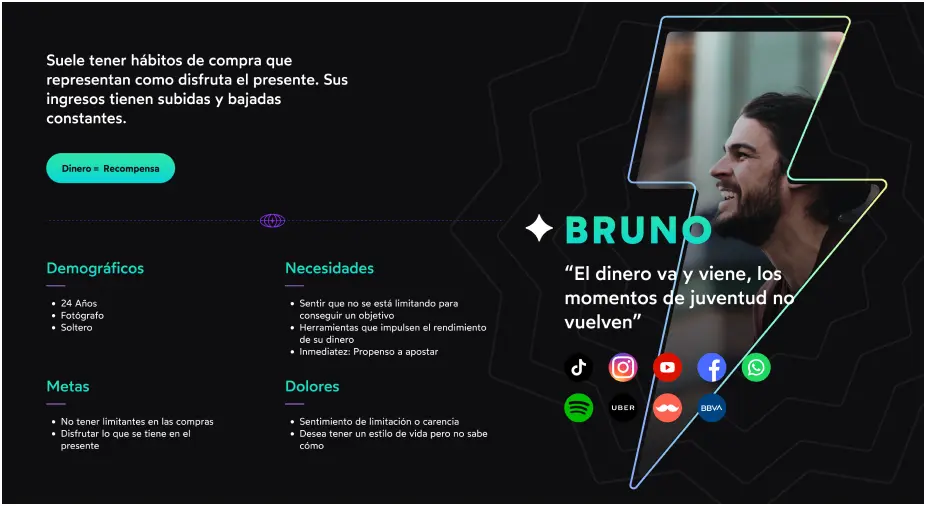
Bruno is our main user; he is young but his ambitious nature leads him to make rash decisions to get what he wants.
Understanding the problem - User needs
Flink's mission is to become the favorite investment application and the easiest to use. It's important for customers to easily find stocks and understand the information needed to make good investment decisions. As the catalog and the information continued increasing, it became evident that the volume of information overwhelmed users. So, the mission of bringing users closer to investments is not being fulfilled.
Based on this assumption, we conducted deep-dive interviews with 14 participants to understand pain points and areas of opportunity and define what actions to take.
What did data tell us?
Important findings to come out of this user testing:
- • 41% of users use their application daily
- • Just under 23% invest in stocks once per week
- • 50% of users feel that having more data helps them make better decisions
- • 28% of users want financial education


Plan of Action
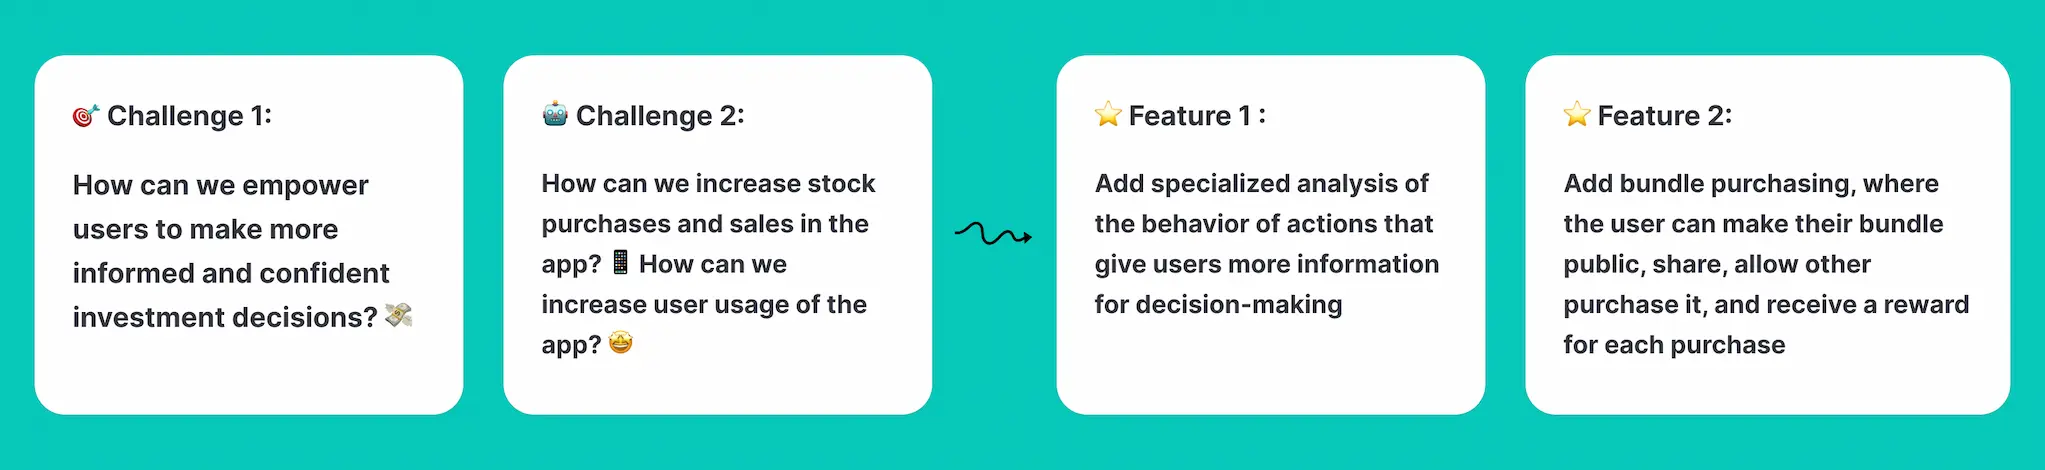
With all of the above in mind, the challenges and objectives were adjusted to solve both the needs of the user and the business, so the design and product teams paired up to to discuss ideas and proposals to solve our challenges and evaluating our ideas, considering technical constraints, and aligning on the kind of user experience we wanted to deliver, we agreed on prioritize two features:
Ideation & Prototyping

A sketching session
We used this session to explore different design proposals and conduct a deeper analysis of the best ideas to choose one to take forward into further exploration.
Prototyping and testing
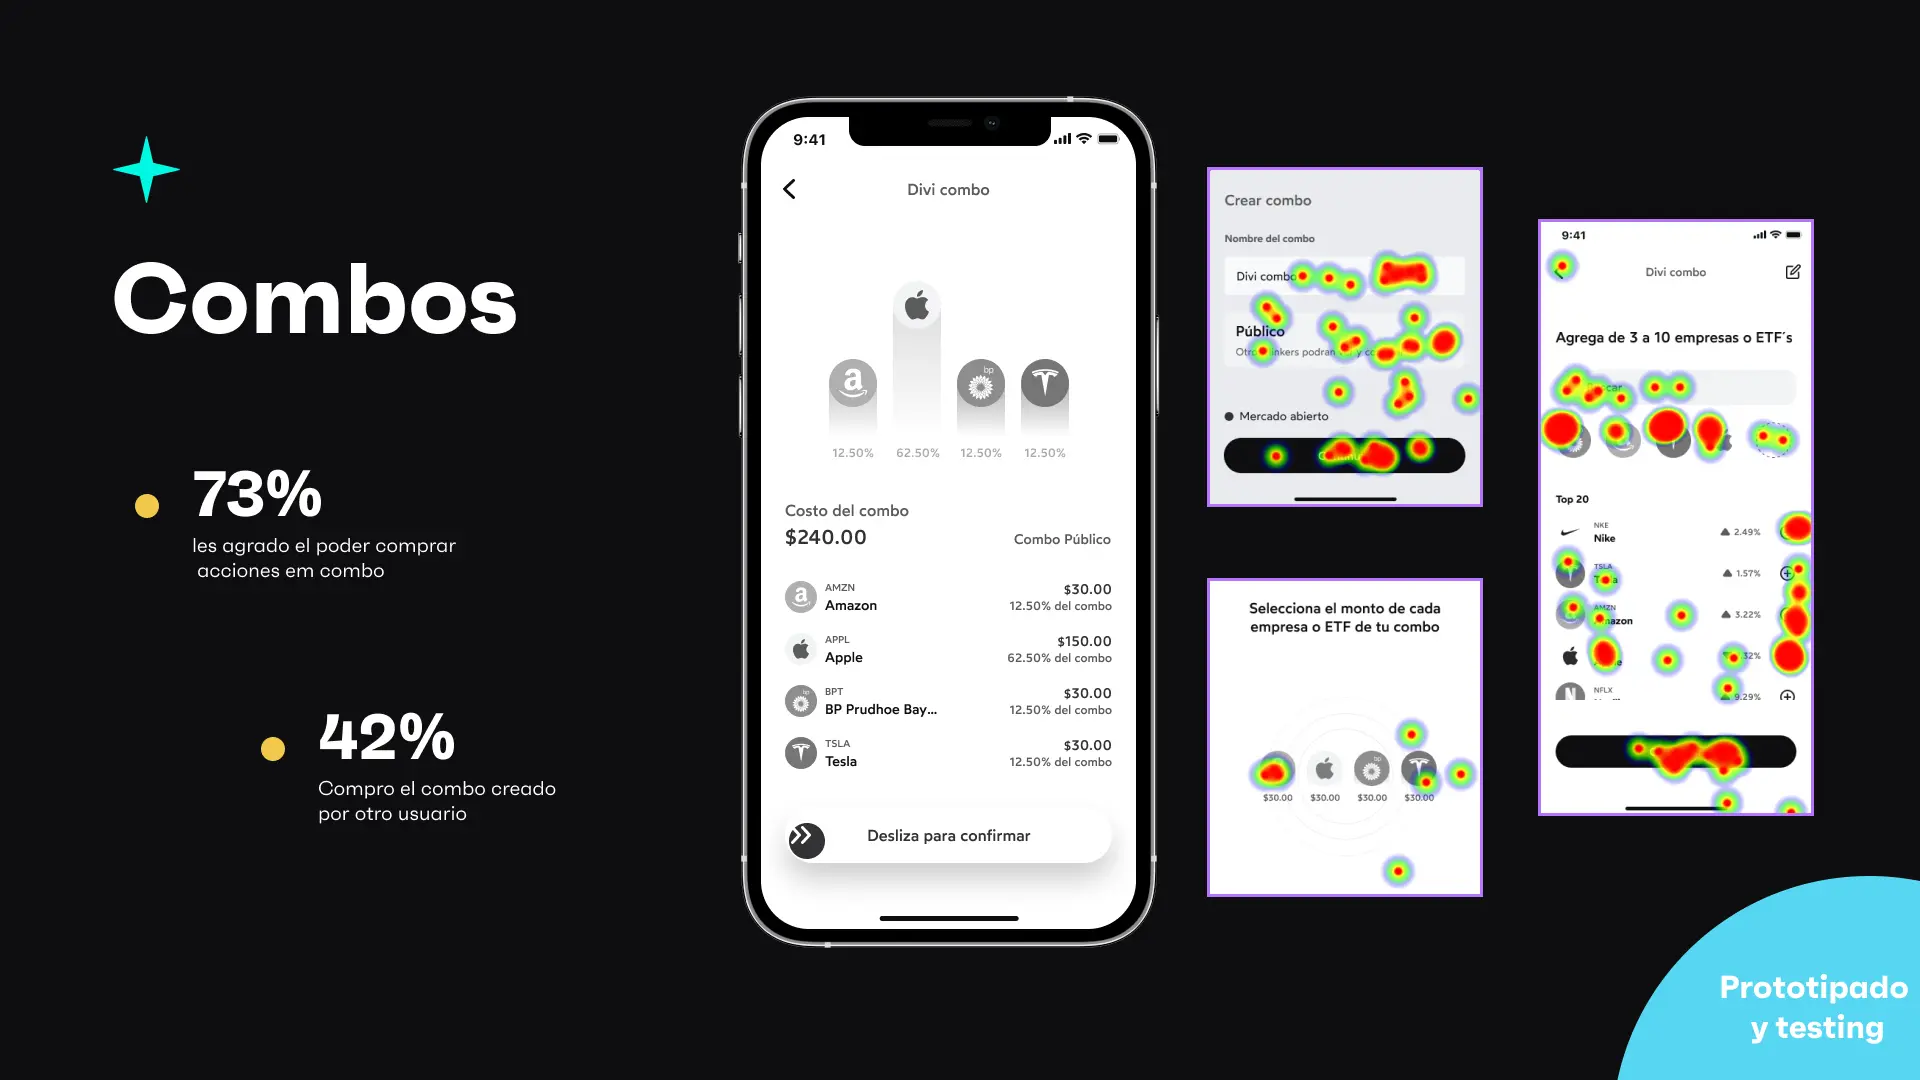
We worked on low-fidelity wireframes based on the most highly-rated idea; then, we did usability tests with 6 users to test our hypothesis and our design.
High fidelity Wireframes
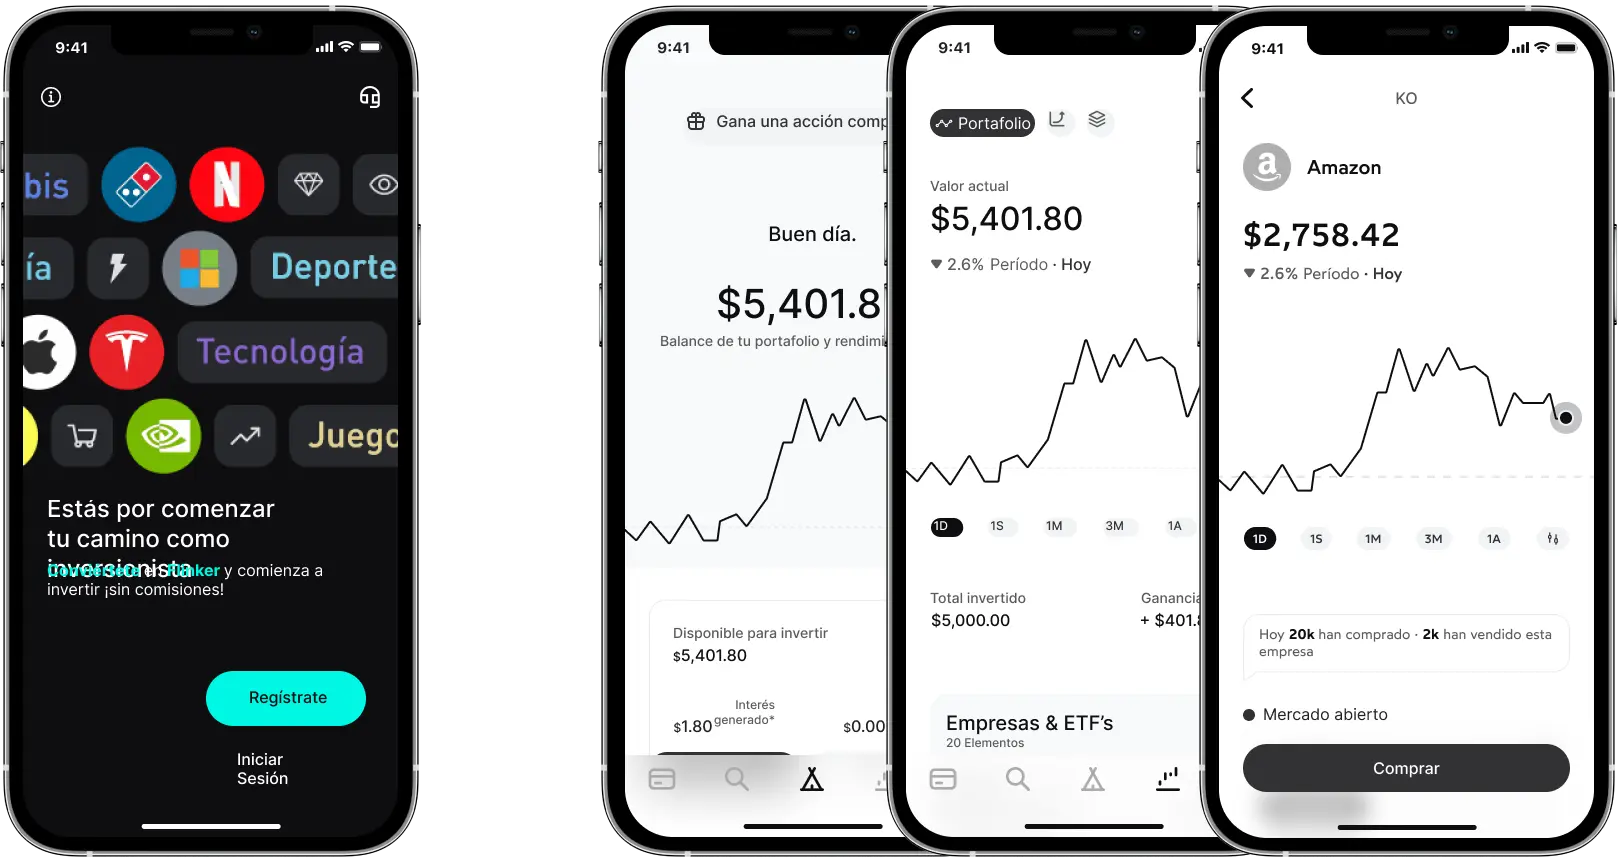
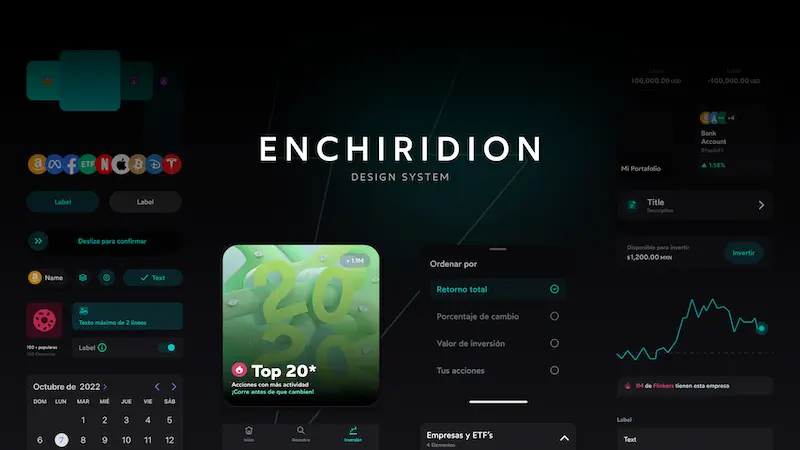
After analyzing the results, we moved on to high-fidelity wireframes using our Design System: Enchiridion.
Design
The first proposal to help users make better investment decisions was a small but complex section in the stock detail view. In this section we suggested actions to take, based on expert opinion accompanied by analysis and related graphs. This strategy helped users and, at the same time, it helps increase the number of daily transactions.
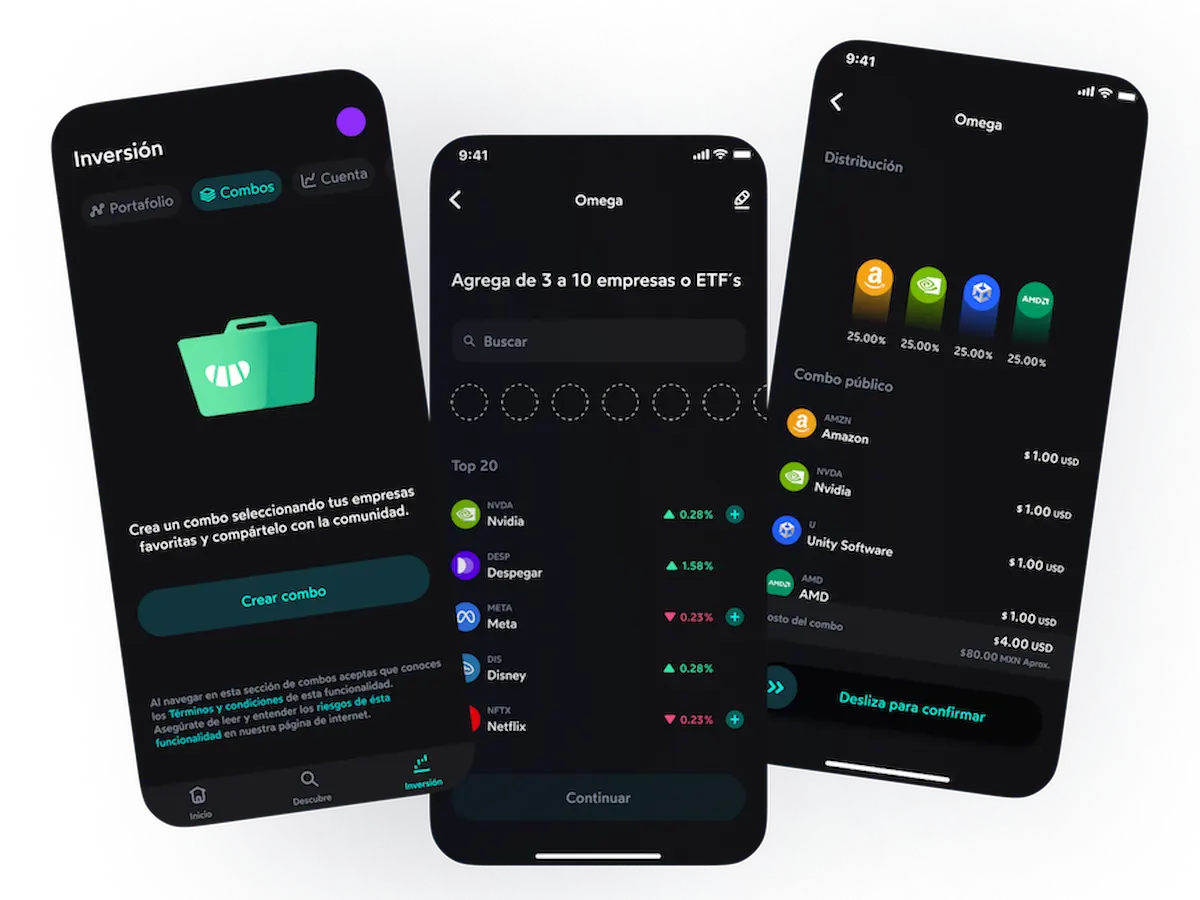
The second proposal focused on increasing the buying and selling of shares without impacking the user experience. This proposal offers users the option to create combos of stocks, which can be shared by expert users and purchased by others.
Measuring Success & Next steps
The next steps are to track the average daily purchases and sales and the average per purchase-sale ticket. In addition to survey users to find out more about their experience on the "Analysts recommend" section and its usefulness in their investment decision-making.

b
a
c
k
*
t
o
*
t
h
e
*
t
o
p
*